6 Ways to Use MarketSmart™ Insights
April 5, 2020
April 5, 2020
MarketSmart Insights, an exclusive tool for Field Nation Premier customers, aggregates data from 3 million field service jobs on our platform so you can get real-time pricing and coverage data on-demand. With this information at your fingertips, you can make more informed decisions throughout the lifecycle of your project. From bidding a new project to finding qualified technicians to assessing the performance of a completed project, MarketSmart Insights can help you win and fulfill more work, increase margins, and fine-tune your pricing strategies.
Here are 6 ways to use MarketSmart Insights across the lifecycle of your project.
Use the links below for quick navigation:
How to establish a basic blended rate | How to control for different site scopes | How to identify coverage gaps | How to find providers | How to generate site-specific pricing using mass upload | How to assess pricing performance
When responding to an RFP, many companies establish a blended rate on which to base that bid – doing so by using historical data and making an assumption that new projects will have similar distributions of high- and low-cost sites. The problem with this approach is that projects can vary significantly in their distribution of high- and low-cost sites. MarketSmart Insights can help you build more accurate blended rates using either your own historical pricing on Field Nation, or pricing data from across the entire Field Nation marketplace.
How to establish a basic blended rate
If your project is fairly homogenous with regard to scope at each site, MarketSmart Insights can help you quickly generate a blended rate across that site list.
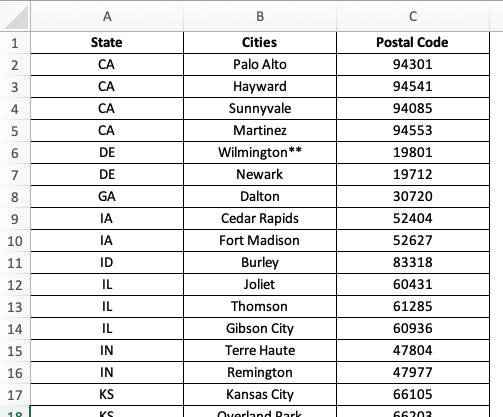
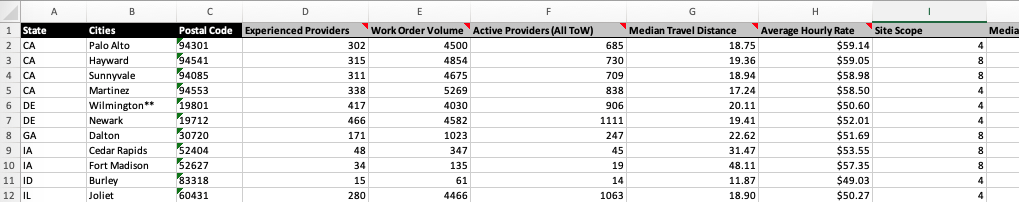
First, create an Excel file with a row for each of your sites. Rows can contain any number of columns; the only requirement is that there be at least one column named Postal Code. For US sites, the data should be 5 digits. For Canadian sites, the data should be 6 characters.
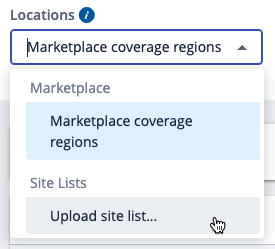
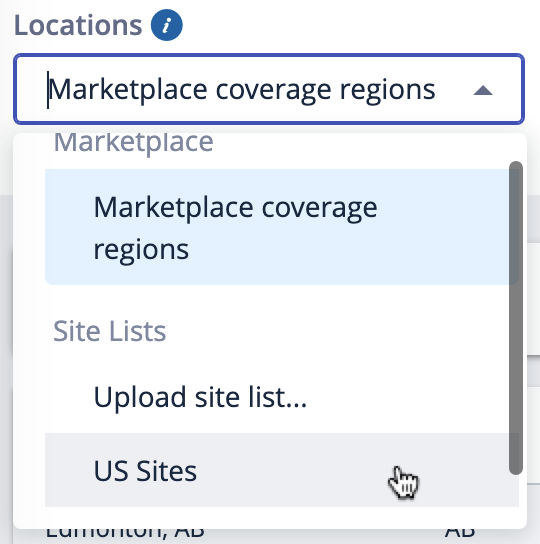
Next, navigate to MarketSmart Insights, click on the “Locations” drop-down, and select “Upload site list”. In the dialog box that appears, add your Excel file, give the list a meaningful title, and click “Import Site List”.
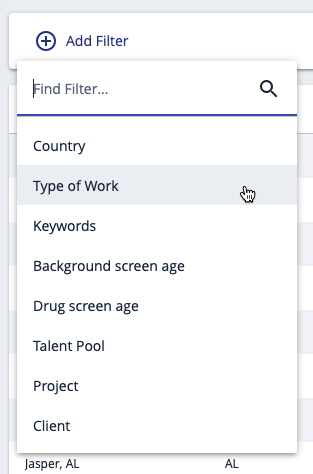
The data displayed will be updated to represent your chosen site list. You can now click “Add Filter” to apply any filters relevant to your project. Each applied filter will dynamically change the displayed data as well as the top-level data shown at the top of the page.
When you’ve finished applying filters, you’ll see the final value for the top-level Average Hourly Rate at the top of the page. While this value provides a good indication of what your blended rate will be, it’s not truly accurate because postal codes with many work orders will be over-represented. To get a true blended rate, you’ll need to export the results and do some calculations with Excel. To begin, click the “Export” button near the top right corner of the page.
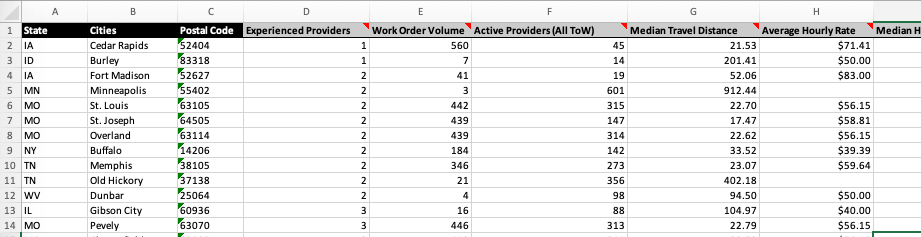
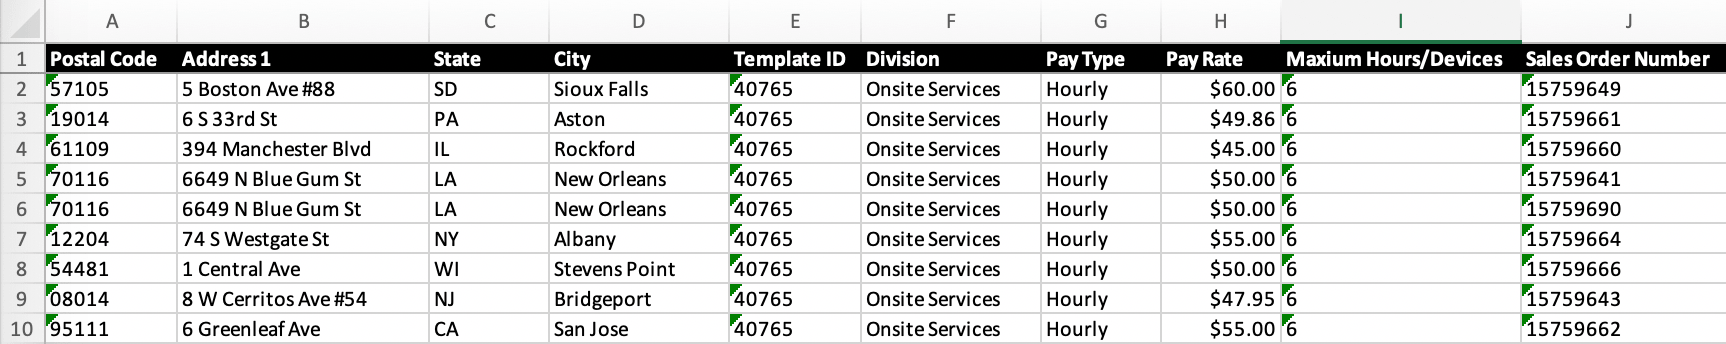
Once you’ve exported the data, you’ll see something like this:
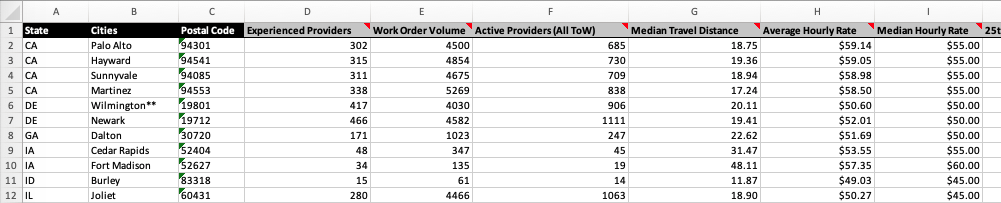
Since this project has the same scope at each site, the blended rate for the project will simply be the average of the rate type you’d like to use. If, for example, you want to use the Average Hourly Rate, scroll to the bottom of the file and add an AVERAGE calculation for Column H.
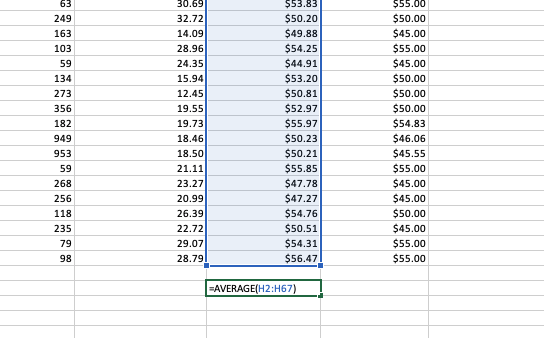
When you perform that calculation, you’ll see that for this example, the final blended rate is $52.23. You can now use that value as an input to your bidding process.
How to control for different site scopes
If your sites have different scopes, you’ll need to do a bit more work to arrive at an accurate blended rate. However, you can leverage all the work from the previous example.
Starting with the file you exported, insert a column representing Site Scope after Column H, and add values to that column representing the number of hours on site for each individual site.
Using these values, you’ll perform a weighted average calculation to arrive at the blended rate. Scroll to the bottom of your file and add the given calculation using the SUMPRODUCT and SUM functions.
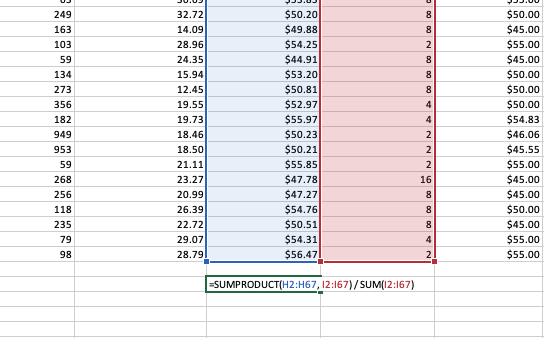
With the new weighted average calculation, you’ll find that the blended rate of $51.37 is nearly $1 / hour lower than the example using equivalent site scopes.
Bidding on projects is an important part of the process, but once you’ve won a project, it’s important to efficiently deploy the project to the Field Nation marketplace. Getting an overall picture of which sites may be problematic from a coverage perspective can be hard if you’re looking work order by work order. MarketSmart Insights can help – enabling you to quickly identify problem geographies and then giving you a roster of experienced technicians that can meet your needs.
How to identify coverage gaps
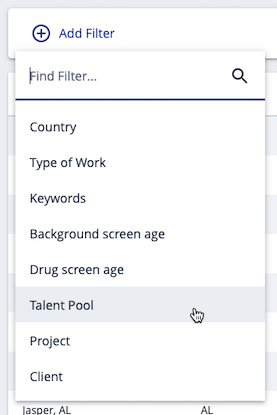
Many Field Nation users like to leverage a specific talent pool when assigning resources for a given project. MarketSmart Insights can help you compare your project site list with your existing talent pools, so you can easily identify low-coverage sites.
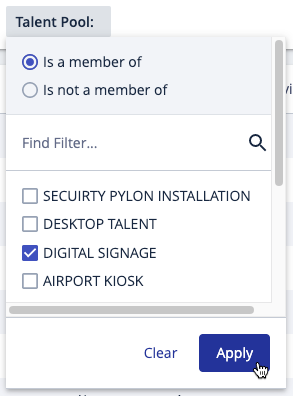
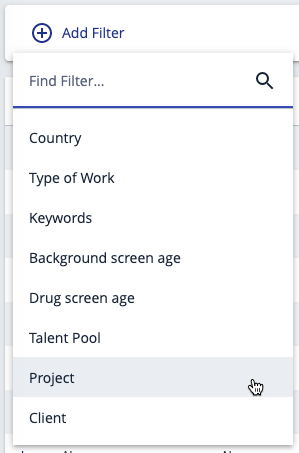
Using the same site list and set of filters from the first exercise, add an additional filter for Talent Pool, making sure to choose the “Is a member of” option.
With the filter applied, the displayed data will only include work orders matching your criteria where the provider that did the work is a member of the selected talent pool. This will give you a good idea of how your talent pool lines up with the skillset and sites for the upcoming project. After you’ve taken a preliminary look at the data, click the “Export” button near the top right corner of the page.
Open the exported file and sort it in ascending order by the Experienced Providers column.
With this sort applied, you’ll be able to quickly see the sites where your talent pool doesn’t have great coverage. For purposes of this example, we’re showing an arbitrary cut-off of 5 or less experienced providers as the threshold for a problem site. Using that threshold, delete the sites with 6 or more experienced providers and save the results.
How to find providers
Now that you’ve found your lowest coverage sites, you’ll want to take a few more steps to find experienced providers who can fill those gaps.
Import the file you just saved as a new site list into MarketSmart Insights. Once you’ve done that, reapply the appropriate filters, but for the Talent Pool filter, choose the “Is not a member of” option.

By choosing the “Is not a member of” option, you’ll see data that represents the work done by prospective providers near the sites where you identified coverage problems. Additionally, since the site list has 100 or less sites in it, you can export the individual provider data by clicking the “Export” button and clicking “Include individual provider data” in the dialog box.
Once you’ve downloaded and opened the report, you’ll see a new Provider Info sheet at the bottom of your Excel document. In this sheet, you’ll see all the providers that have done work which meet your criteria broken out by site.
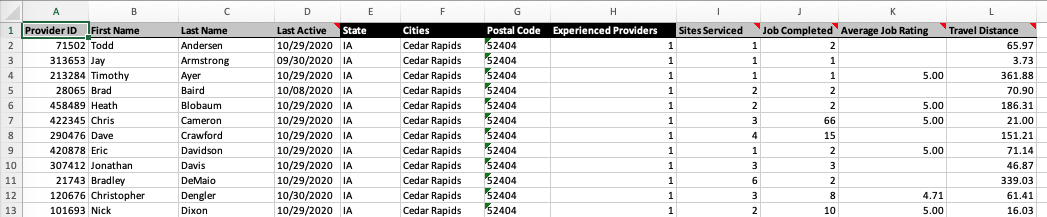
For each site, you’ll get detailed information about each provider that has completed relevant work within 60 miles of that site. You’ll get Provider ID and name to let you identify them on Field Nation, but you’ll also get a number of data points you can use to do some preliminary vetting. You can see how many jobs they completed, their average job rating, and the distance traveled. Each of these metrics is specific to the work completed within 60 miles of each individual site.
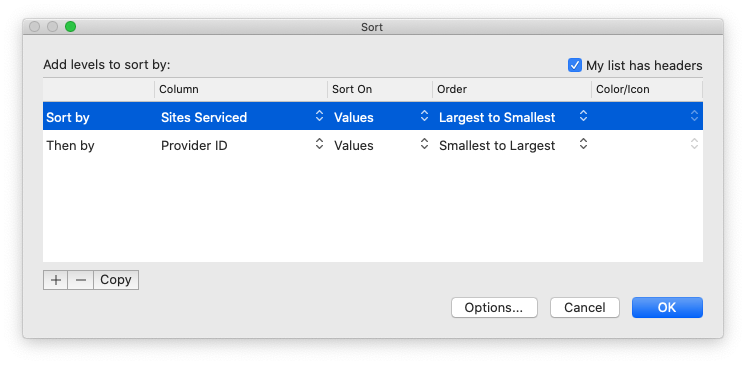
One thing to note is that providers may actually appear for more than one of the sites in your list, so we’ve broken this information out as another column called Sites Serviced. This column gives you the total number of sites in your list where the given technician has completed work within 60 miles of your site. Sorting by this column can help you quickly identify the highest-leverage technicians for your project.

In this example, you can see that quite a few providers can potentially service more than one of your sites. One technician is completing work all over the midwest. Since he’s not currently in a talent pool, you probably want to reach out to him for further vetting.
Now that you’ve proactively built a roster of technicians for your project, you’ll need to create your work orders. If you aren’t using the regional pricing that drove your bidding process to set the pricing on those work orders, you’ll likely end up overpaying in lower-cost areas. Additionally, your dispatch team may have to deal with excessive negotiations in higher-cost areas. MarketSmart Insights can help you avoid all of these issues by easily integrating with your mass work order creation process.
How to generate site-specific pricing using mass upload
When you export a site list from MarketSmart Insights, it will include every column that was in the initial upload of that site list. If you use a work order mass upload as a site list, the pricing data provided in the export can be used to quickly establish site-specific pricing for your work orders. If you use the same pricing in your work orders that you used when bidding your project, you’re much more likely to achieve the pricing you planned for.
To start, download the work order mass upload template from the Manage -> Import Spreadsheets feature and use that as the basis for your site list.
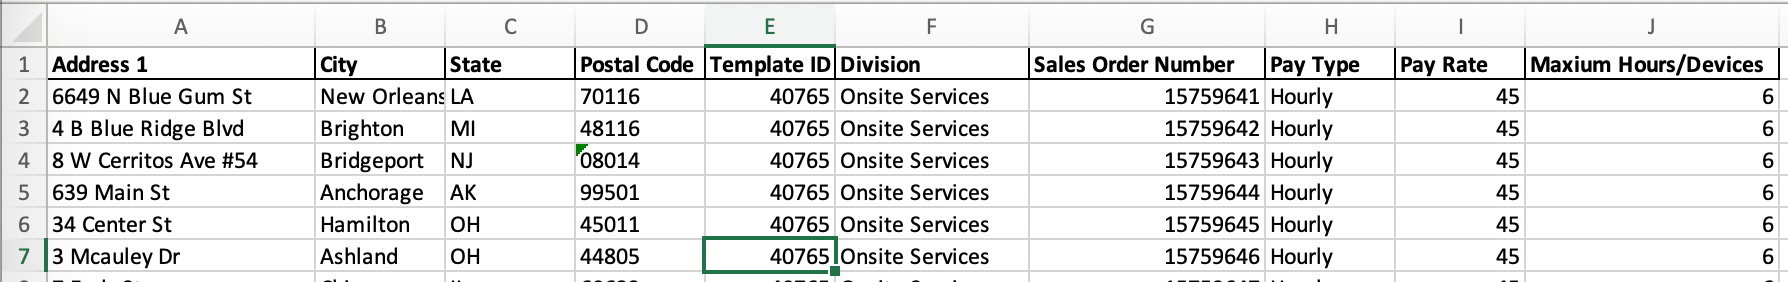
In this example, you can see that we’re starting with a Pay Rate of $45/hr for each of the work orders represented in this document. That’s less than ideal for all the reasons already stated. Here’s how you can use MarketSmart Insights to quickly achieve site-specific pricing.
First, import this document as a site list. Next, apply any filters that make sense for the project in question. Finally, export the resulting data and open the downloaded file. You’ll see that the regional pricing data has been inserted into your original document.
To obtain site-specific pricing, simply copy the pricing data from your column of choice (e.g., Median Hourly Rate) and paste those values into the original Pay Rate column. Once you’ve done that, you can delete the columns that were added by MarketSmart Insights. The resulting file can now be run through the standard mass upload process. Each of the created work orders will have pricing appropriate to local market conditions.
While a project is in progress, or after it’s completed, it’s important to measure project performance. There are several ways to think about performance, including pricing achieved versus pricing bid, percentage of work orders with on-time arrivals, and technician quality ratings. Currently, MarketSmart Insights can help you measure pricing performance, and we’re working on supporting additional performance metrics based on customer feedback. If you have specific metrics in mind, please get in touch with your account representative.
How to assess pricing performance
To assess pricing performance for our project, start with the Excel file you created to generate a blended rate. This file will be the record of the pricing used to generate your bid.
From here, you can use your original site list to generate a report of the actual achieved pricing for your project by selecting your original site list from the “Locations” drop-down. If you deleted the site list, you’ll need to re-upload it.
Apply your original filter criteria, which can be found in the Metadata sheet of the Excel file you used to create a blended rate. In addition to that criteria, add a filter for “Project” containing the relevant work orders. With this filter applied, the per-site pricing data is limited to only those work orders that were a part of your Field Nation project. You can now export this data and use it to compare against your bid pricing.

Open both the project-specific and original bid Excel files and verify that they’re both sorted by Postal Code. Then, select the entire Average Hourly Rate column from the project-based export and insert it next to the Average Hourly Rate column in the bid file. You can then insert a second column after these two where you’ll enter a calculation subtracting one column from the next.
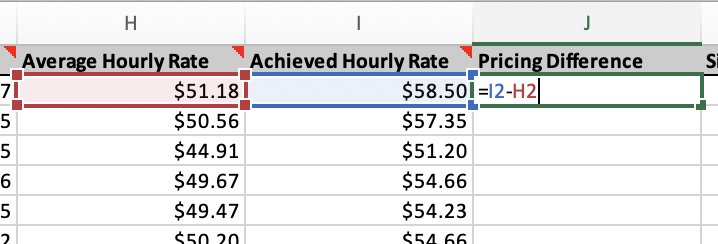
Copy this calculation to all rows in the Pricing Difference column and then apply a descending sort to easily see which sites performed well and not so well relative to your initial plan.
Want to learn more about how MarketSmart Insights can help drive your business goals? Talk to your Field Nation account rep.
RELATED RESOURCES
Blog
Finding skilled and reliable technicians is consistently top-of-mind for field service leaders. Sindy Eichen, an experienced Field Service Manager for a global IT solutions provider, discusses how a technician quality program can help leaders enhance their customer experience and improve client efficiency.
BlogBlog
A key lesson Sandra Williams has learned as a field service delivery leader is that being a great buyer has a ripple effect on success. In this blog, Sandra shares nine ways her company brings in top-notch techs to consistently delivery quality client outcomes, especially when it comes to break-fix.
BlogBlog
Emerging digital signage trends highlight technological advancements and underscore the shifting needs of businesses in a digitally driven market. Here are five digital signage trends for 2024 and their implications for field services.
Blog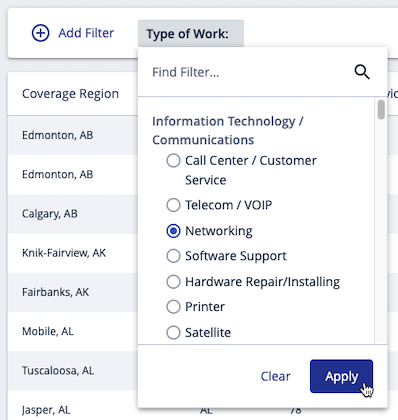